 Manayard
Can Machine Learning Predict Star Trek's Most Popular Commander Cards?
I’m building Manayard, a tool for finding Magic: The Gathering cards that work together in Commander. On the side, I wanted to know whether a computer could learn from older cards to guess which new cards people will put in their decks. I’m a beginner at machine learning, so treat this as an experiment, not expert advice.
The test case is Magic’s Star Trek release: the main set, TRK, and its Commander decks, TRC, both out on November 13. I forecast all 191 new cards from the two: 70 commander candidates, 107 other spells and 14 lands. Reprints and basic lands are left out.
The questions
- Can a model that reads older cards predict which new cards Commander players will use most?
- Do any of the eight methods I tried beat a simple model that only reads a card’s text?
- What does the best method forecast for TRK and TRC?
“Use most” means how many Commander decks include a card, whether in the 99 or as the commander. I measure it with `edhrec_rank`, a popularity rank in Scryfall’s public card data. It is not win rate, power level or how often a card leads a deck.
What I found
- The best method in my first test was a blend of two models. It raised my main score from 0.469 to 0.489.
- In two later tests, that gain did not hold up. The blend did slightly worse than the text model on six earlier releases and slightly better on early-October releases. Both differences are small enough to be luck.
- None of the other methods reliably beat the simple text model.
- The Star Trek forecast is a rough ordering. I’m keeping the text model as the baseline to beat and the blend as an experiment.
The rest of this post walks through each step, from the data to the forecast.
How a forecast is made

The models learn from 32,048 older Commander-legal cards. For each one they see the rules text, mana cost, colors, types and keywords, plus how popular it is. They never see a card’s name, set or release date. A new card gets read the same way and receives a score. A higher score means the model expects the card in more decks.
The text model is the simplest method and the baseline every other method has to beat. It gives each word and short phrase a weight. Phrases that appear on popular cards get higher weights, and very common words count for less. A card’s score is the sum of its weights. The technique is called ridge regression. “Ridge” means no single phrase is allowed to get an extreme weight.
The pairwise model learns differently. It looks at two cards from the same release and guesses which one ended up in more decks. It’s like a taste test that asks “which of these two?” instead of “rate this out of 10.” It compares commanders only with commanders, and other cards only with other cards. It also reads facts from Manayard’s parser, which turns rules text into structured descriptions of effects, their costs and their conditions.
The blend averages the two. First each model’s score becomes a percentile: the share of the 32,048 older cards that scored lower. If the text model places a card above 90% of older cards and the pairwise model places it above 96%, the blend score is 0.93. Averaging can cancel out some of each model’s mistakes, the way averaging two judges’ scorecards can.
How I tested the methods

To test a forecaster fairly, you hide the answers, make predictions, then check. I trained each method on older cards and asked it to rank cards from later releases that it had never seen, but whose popularity I already knew.
The score is the Spearman correlation between the model’s order and the real popularity order. It compares rankings, not exact numbers. Think of predicting the finishing order of a race. An exactly right order scores 1, a guess with no relation to the result scores about 0, and an exactly backwards order scores −1. It is not a percentage of correct answers. I compute it within each release, so a card is only compared with cards that came out alongside it, then average across releases. Each test gets two scores, one for all cards and one for commander candidates only. My main score is the average of the two.
I ran three tests:
- Test 1, development. Train on cards from before 2024 and test on cards from 2024 through March 2026. A development set works like practice exams: I used these results to choose a method, so they flatter whichever method I chose.
- Test 2, six earlier releases. Retrain on cards from before April 2026 and test on six releases from April to August 2026. A held-out set should be like a final exam you haven’t seen. I had looked at these six releases in earlier experiments, though, so this is a repeated exam, not a fresh one.
- Test 3, early October. The same models as test 2, tested on three groups of cards from one early-October release family. Their popularity ranks were only 18 days old when I saved them, so they will still change.
I chose the blend after test 1 and froze it before scoring tests 2 and 3. I didn’t change any model or card afterward.
The best method: a text-and-pairwise blend
Each cell shows the score for all cards / commander candidates. Higher is better.
| Method | Test 1: development | Test 2: six earlier releases | Test 3: early October |
|---|---|---|---|
| Text model (baseline) | 0.5766 / 0.3605 | 0.6354 / 0.5243 | 0.7363 / 0.6012 |
| Text plus updated parser facts | 0.5859 / 0.3434 | 0.6361 / 0.4990 | 0.7374 / 0.6368 |
| Five nearest older cards | 0.3480 / 0.1587 | 0.3963 / 0.1505 | 0.4308 / 0.3290 |
| Pairwise model | 0.5768 / 0.3653 | 0.6008 / 0.5102 | 0.7580 / 0.5535 |
| Boosted trees | 0.5453 / 0.3438 | 0.5899 / 0.4033 | 0.6890 / 0.5707 |
| Learning-to-rank trees | 0.4797 / 0.2977 | 0.5455 / 0.3750 | 0.5760 / 0.5314 |
| Text + pairwise blend (selected) | 0.5930 / 0.3846 | 0.6196 / 0.5237 | 0.7563 / 0.6025 |
| Text + parser-fact correction | 0.5934 / 0.3726 | 0.6337 / 0.4848 | 0.7612 / 0.6678 |
In test 1 the blend had the highest main score: (0.5930 + 0.3846) / 2 = 0.489, compared with (0.5766 + 0.3605) / 2 = 0.469 for the text model. That is the gain from 0.469 to 0.489.

The chart shows how far the blend moved from the text model in each test. In test 2 it fell behind on all cards by 0.016. In test 3 it came out ahead by 0.020. To judge whether a gap is real, I recomputed it many times, each time drawing the releases at random with repeats allowed. The lines show the range those redraws produced. Every line crosses zero, so I can’t tell any of these gaps apart from luck. Test 3’s commander score covers only two of its three groups.
The Star Trek forecast
For the final forecast I retrained the blend on all 32,048 older cards and scored the 191 Star Trek cards. None of them were used in training. Each card is ranked against the others in its own category. “Text-only” is the baseline text model. “October 21” is my previous forecast, which used the text model plus an earlier version of the parser.
| Commander candidate | Set | Blend | Text-only | October 21 |
|---|---|---|---|---|
| The Borg Queen | TRC | 1 | 1 | 2 |
| Captain Jean-Luc Picard | TRK | 2 | 2 | 4 |
| Dr. Joseph M’Benga | TRK | 3 | 5 | 1 |
| Dr. Beverly Crusher | TRK | 4 | 3 | 5 |
| Quark, Humble Proprietor | TRK | 5 | 6 | 6 |
| Worf, Honor-Bound Warrior | TRK | 6 | 7 | 8 |
| Captain Kathryn Janeway | TRK | 7 | 8 | 3 |
| Dal R’El, Augment Orphan | TRK | 8 | 10 | 11 |
| Locutus of Borg | TRC | 9 | 9 | 23 |
| Captain Michael Burnham | TRK | 10 | 11 | 9 |
| Other spell | Set | Blend | Text-only | October 21 |
|---|---|---|---|---|
| Starship Enterprise | TRC | 1 | 2 | 1 |
| Starfleet Communicator | TRC | 2 | 3 | 2 |
| Live Long and Prosper | TRK | 3 | 1 | 3 |
| Deep Space 9 | TRK | 4 | 5 | 6 |
| U.S.S. Reliant, From Hell’s Heart | TRK | 5 | 12 | 7 |
| Command Chair | TRC | 6 | 6 | 4 |
| U.S.S. Enterprise-D, Galaxy-Class | TRK | 7 | 4 | 12 |
| Borg Cube | TRK | 8 | 9 | 8 |
| U.S.S. Discovery, at Black Alert | TRK | 9 | 10 | 5 |
| Shields Up! | TRK | 10 | 8 | 9 |
All 14 new lands are in TRK. The blend and the text model put the same three lands on top, in a different order: Starfleet Academy, Quark’s Bar and The Unicomplex.
The top two commanders match between the blend and the text model. Lower places move more: U.S.S. Reliant is 5th in the blend and 12th in the text model. Compared with the October 21 forecast, the blend moves 185 cards to a different overall place. Both the method and the parser changed since then, so I can’t say which one caused the movement.
The full 191-card CSV lists every card’s set, category, blend score and its blend, text-only and October 21 places.
What failed
These eight methods are a small set I chose to compare, not a survey of machine learning. Within that set:
- Five nearest older cards finds the five most similar older cards and averages their popularity. It scored lowest in every test. Cards that read alike are not necessarily played alike.
- Boosted trees and learning-to-rank trees are more flexible methods that build many small chains of yes-or-no questions about a card. Both trailed the text model in every test.
- Text plus updated parser facts changed little. It was slightly higher on all cards in each test, but lower on commander candidates in tests 1 and 2.
- The pairwise model on its own nearly tied the text model in test 1 and trailed it on all cards in test 2.
- Text plus a parser-fact correction adds a second model that learns where the text model tends to go wrong. It had the best test 3 scores (0.7612 / 0.6678). It came second in test 1, though, and had the weakest test 2 commander score of the top methods (0.4848). I had committed to the test 1 winner, so I didn’t switch. Switching after seeing test 3 would be like picking an answer after reading the answer key.
Correlation can also look decent while missing the cards people care about most. I checked whether each release’s single most-played card landed in a model’s top three. On the six earlier releases, the blend did this for 2 of 6 overall winners and 2 of 6 commander winners, against 2 of 6 and 3 of 6 for the text model. On the October groups it found 0 of 3 overall winners and 2 of 2 commander winners, against 0 of 3 and 1 of 2. Neither model reliably spots a breakout card.
Limitations
- Disagreement is not confidence. The CSV and the repository report keep every method’s place for every card. A wide spread shows where methods disagree. It is not an error bar.
- Scores are not probabilities. A blend score of 0.93 does not mean a 93% chance of being popular.
- The labels are young. Test 3’s ranks were 18 days old, all from one release family, and every test uses one snapshot of popularity rather than ranks taken at the same card age.
- Parsing is incomplete. 58 of the 191 cards still have rules text the parser can’t describe, and a clean parse can still be wrong.
- Rules text isn’t gameplay. The model doesn’t play games. It can’t tell how much mana Command Chair makes with your commander, or what Live Long and Prosper’s life gain and card draw are worth after you cast a seven-mana spell.
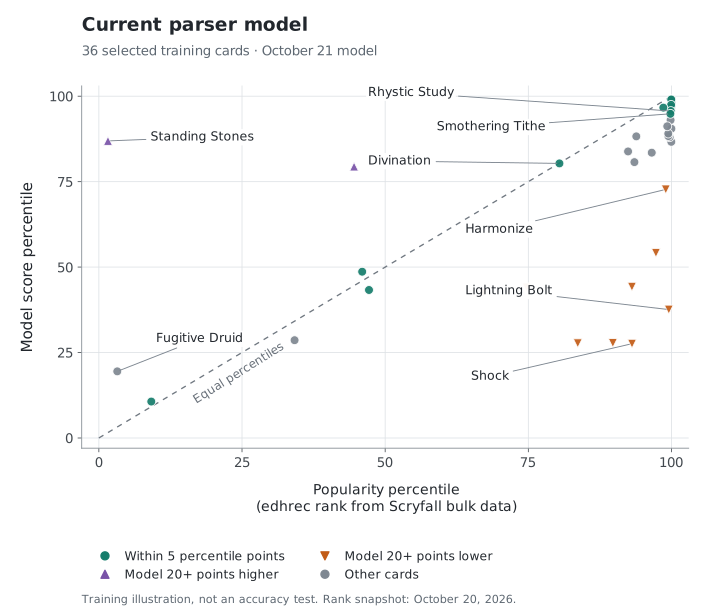
This plot shows the kind of mistakes a text model makes. It uses my October 21 text-plus-parser model, not the blend, on 36 older cards I picked as examples. Both axes are percentiles among 32,048 cards, and a dot on the diagonal line means the model got that card’s popularity right. The model underrates Harmonize, Lightning Bolt and Shock, overrates Standing Stones, and places Divination almost on the line. Rhystic Study (95.7 model, 99.9 observed) and Smothering Tithe (94.9 model, 99.8 observed) are close, even though that parse of Rhystic Study misses the opponent’s choice to pay. A later parser change addresses it. The 36 examples were training cards, so they show the type of error, not accuracy on new cards.
Next steps
After the November 13 release, I’ll compare these forecasts with December `edhrec_rank` from Scryfall, including the misses. It will be the first check where no model and no choice of mine saw the answer in advance. Until then the text model stays the baseline and the blend stays an experiment.
Next I want to test one kind of effect in small, controlled game situations, check those results separately, and see whether they improve a future forecast.
The whole experiment ran without paid services. `scripts/forecast_cards.py` loads the saved blend and scores new cards without retraining; it reproduced all 191 scores and places exactly in 11.6 seconds. The full method comparison and code are in the repository report.
Card and spoiler data: Scryfall’s TRK and TRC listings, as saved on October 20.